Bed-Stuy's Median Price Depends on Which Bed-Stuy You Mean
September 3, 2026
September 3, 2026
Ask three different sources what the median home price is in Bedford-Stuyvesant right now, and you will get three different answers, and none of them is wrong. In the three months ending June 2026, a widely used tracker reported a median sale price of $1.3 million. A submarket analysis published in February 2026 put the all-residential median closer to $1.165 million. A first-quarter 2026 breakdown of single-family closings alone put that figure at $2.12 million, up 17 percent year over year. Multi-family closings in the same quarter had a median price of $1.72 million, with prices ranging from $780,000 to $3.25 million.
If you are trying to figure out whether a listing on Decatur Street is priced fairly, none of those single numbers tell you much on their own. That is the actual story here. Bed-Stuy is not one market wearing different disguises depending on who ran the report. It is several markets that happen to share a neighborhood name, and the median you land on depends entirely on which slice of that neighborhood you are measuring.
The spread is not a data quality problem. It is a composition problem. When a tracker reports "Bed-Stuy median," it blends co-ops, condos, single-family brownstones, and multi-family townhouses into a single number, and the mix of what sold that quarter shifts the result. A quarter heavy with multi-family closings pulls the blended median down toward that $1.72 million figure. A quarter where single-family brownstones dominate pulls it up toward $2.12 million. Neither number describes the same transaction that a buyer is actually shopping for.
This matters most for anyone using a headline median to sanity-check a specific listing. A two-family townhouse priced at $1.3 million and a single-family brownstone priced at $1.3 million are not competing in the same buyer pool, even if they sit on the same block. One is priced against the $1.72 million multi-family median. The other is priced well under the $2.12 million single-family median. Reading the wrong comparison set can cause buyers to either overpay out of fear of missing out or underbid and lose a property they actually wanted.
Here is roughly how the first quarter of 2026 broke out by property type, based on the closing data available:
Property type | Q1 2026 median | Closing range | Volume |
|---|---|---|---|
Single-family | $2.12 million | Most activity $1.5M–$3M | 22 closings |
Multi-family | $1.72 million | $780,000–$3.25 million | 93 closings |
All-residential blend | roughly $1.165M–$1.4M | Varies by report | Composite of all types |
The gap between the single-family and multi-family medians is nearly $400,000. That gap alone should end the habit of quoting one Bed-Stuy number and applying it to every property type in the neighborhood.
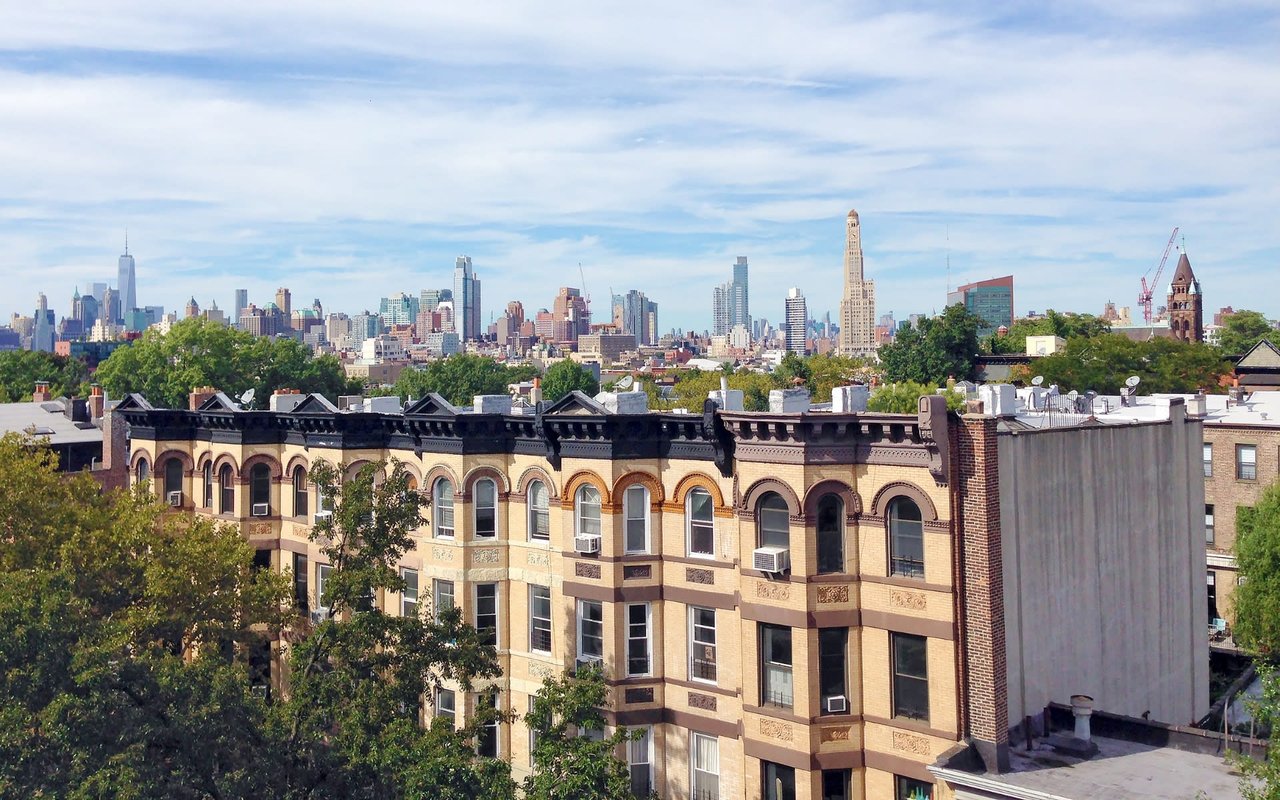
Property type explains part of the spread. Landmark status explains a large piece of what happens within each type. Bed-Stuy contains two historic districts, the Stuyvesant Heights Historic District and the Bedford Historic District, both of which are reviewed and regulated by the New York City Landmarks Preservation Commission. Properties in these districts, particularly along blocks like Decatur, Macon, and Bainbridge, command a documented price premium of roughly 5 to 10 percent when their original facades and detailing are well preserved.
That premium is not about aesthetics for their own sake. It reflects scarcity and permanence. A landmarked block cannot be altered in ways that would erode its character, meaning the buyer is paying for a level of architectural certainty that a non-landmarked block simply cannot guarantee. The tradeoff is real too. Any exterior renovation within a historic district requires review by the Landmarks Preservation Commission, which adds cost and time that a buyer planning major work should budget for before making an offer.
So when you see a listing on a Stuyvesant Heights block priced above what a similar-sized property commands two streets over, the premium is not marketing. It is the market pricing in a preservation guarantee that non-landmarked blocks do not carry.
Landmark status sets a ceiling on the value of a preserved facade. Condition sets everything else. The clearest way to see this is to directly compare recent as-is and renovated sales. One property on Stuyvesant Avenue sold as-is for $1.71 million, working out to roughly $534 per square foot. A renovated sale on Quincy Street closed at $1.999 million, or about $846 per square foot. A high-end restoration on Jefferson Avenue closed at $2.675 million, around $826 per square foot.
That is a swing of roughly $290 to $310 per square foot between an unrenovated property and a comparable renovated one, on top of whatever the landmark premium adds. For a typical Bed-Stuy brownstone running 2,500 to 3,000 square feet, that difference is worth $725,000 to $930,000 before you even factor in lot width. A 30-foot-wide property on Greene Avenue and a 20-foot-wide renovated townhouse on Stuyvesant Avenue are not directly comparable, no matter how close their addresses are, and treating them as interchangeable is where many pricing mistakes start.
If you are evaluating an as-is property, the renovation gap is not a discount to celebrate. It is a bill that has not arrived yet.
Bed-Stuy's multi-family volume, 93 closings in the first quarter of 2026, compared with 22 single-family closings, is not a coincidence. Roughly 79 percent of Bed-Stuy residents rent rather than own, which means the neighborhood has a deep, structural tenant pool. That is the entire logic behind buying a two- or three-family building here rather than a single-family brownstone at a comparable price point: the rental units carry part of the mortgage.
That only works cleanly when the rental setup is legal and documented. Buyers evaluating a multi-family purchase for the income potential need clear answers on certificate of occupancy status, unit configuration, and lease terms before that projected rent becomes real underwriting rather than a hopeful number in a listing description. A building advertised with strong rental upside but no clean paperwork behind it is not actually offering that upside. It is offering a project.
Before comparing any Bed-Stuy listing to a headline price, it helps to know:
Those four questions do more to price a Bed-Stuy property correctly than any single median ever will.
Is Bed-Stuy landmarked everywhere? No. Only the Stuyvesant Heights and Bedford Historic Districts fall under Landmarks Preservation Commission review. Plenty of Bed-Stuy blocks lie outside those boundaries and follow entirely different renovation rules.
Does a renovated brownstone always outprice an as-is one by the same margin? No. The gap in recent sales ranged from roughly $290 to $310 per square foot depending on the specific renovation quality and the comparison property, which is why a block-level comparison matters more than a neighborhood-wide rule of thumb.
Why does multi-family volume outpace single-family so heavily in Bed-Stuy? The neighborhood's renter-heavy population, close to 79 percent, gives multi-family owners a built-in tenant base that supports the mortgage, which is a different buying calculation than a single-family purchase built purely on owner-occupant demand.
If you are trying to make sense of a Bed-Stuy listing against a market that keeps producing different headline numbers, that is exactly the kind of block-by-block read Darrell Williams works through with clients before an offer goes in. Schedule a consultation to talk through the specific property, block, and numbers in front of you.
This article is general information, not legal, tax or financial advice. Consult a qualified professional about your situation.




Darrell Williams works in Manhattan, Brooklyn, Queens, and the Bronx. His expertise includes new development sales/leasing projects, investment sales, and 1st time home buyers. Whether you're purchasing or selling, he'll keep you feeling comfortable and confident from start to end.

Darrell Williams
Compass Headquarters 110 5th Ave 3rd floor New York, NY 10011