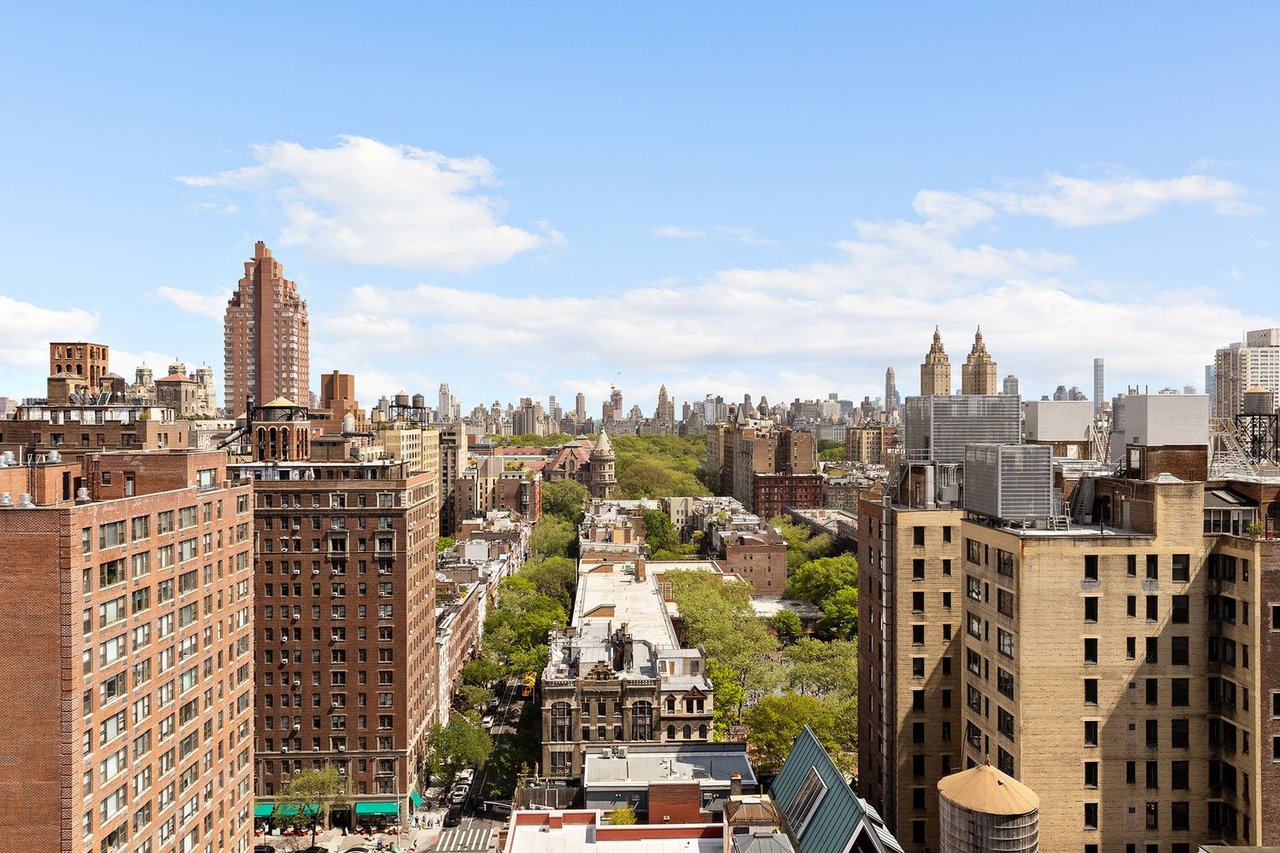
Manhattan Real Estate Market Report Q3 2026: Sales Rise as New Listings Hit a 10-Year Low
Manhattan's housing market held firm in the third quarter. Closed sales rose 2.7% from a year ago even as new listings fell to their lowest third-quarter level in a decade, and buyers kept competing for well-priced homes.
Manhattan real estate market at a glance
Higher borrowing costs and economic uncertainty were still in the picture, but buyers stayed active when homes were priced right. The median sale price rose 4.6% to $1,250,000, while the average price dipped 5.0% as fewer ultra-high-end closings pulled the average down. Homes that needed significant work or were priced ambitiously took longer to sell.
Closed sales, Q3 2026 | Q3 2026 | vs. Q3 2025 |
|---|---|---|
Number of sales | 3,183 | +2.7% |
Sales volume | $6,332,780,766 | −2.4% |
Median sale price | $1,250,000 | +4.6% |
Average sale price | $1,989,564 | −5.0% |
Average price per sq ft | $1,497 | +1.8% |
Average discount from list | 6% | 7% last year |
Average days on market | 99 | 28% took 180+ days |
Condos vs. co-ops in Manhattan
Condo sales, up 8.6%
- Median sale price
- $1,786,519 (+8.3%)
- Average sale price
- $2,676,783
- Average price per sq ft
- $1,719
- Average contract price
- $2,888,864 (+12.2%)
Co-op sales, up 0.8%
- Median sale price
- $887,500 (+3.2%)
- Average sale price
- $1,407,978
- Co-op contracts, 4+ bedrooms
- +45.8% year over year
Condos drove the quarter's growth, with sales and median prices both up more than 8%. Co-ops held steady, and demand for family-sized co-ops was especially strong: contracts for co-ops with four or more bedrooms jumped 45.8% from a year ago.
Manhattan luxury real estate: where the strength is
The biggest gains came at the higher end. Sales from $3 million to $5 million rose 32.2% to 374 deals, with similar growth for condos and co-ops. Above $10 million the picture was mixed, mainly because there simply weren't enough homes for sale at those prices after a strong first half of the year. Contract activity at the very top tells a different story: 14 contracts above $20 million were signed, up 75.0% from Q3 2025.
Contracts signed: a look ahead
Contracts are the best early signal of where closed sales are headed. Manhattan buyers signed 2,075 contracts in Q3 2026, down 12.0% from a particularly strong Q3 2025, when contract activity had jumped 20.6%. Year to date, the trend is still positive, with 3.1% more contracts signed through the end of September. The median contract price was unchanged at $1,195,000, while the average rose 6.1% to $2,074,370.
Buyers also committed to larger homes. Contracts for homes with four or more bedrooms rose 6.6%, and the $5 million to $10 million range held steady, up 0.9%.
Manhattan housing inventory hits a 10-year low for new listings
Supply is the story of the quarter. Only 2,251 new listings came to market, down 28.4% and the lowest third-quarter total in 10 years. Total active listings fell to 6,028, down 10.9% from a year ago and 8.9% from Q2. With fewer choices, some buyers and sellers took longer to find common ground. The average asking price of active listings rose 7.3% to $3,186,207, as more of what remains on the market sits at higher price points.
Manhattan neighborhoods: Q3 2026 submarket breakdown
Here's how each part of Manhattan performed, compared with the third quarter of 2025. The bar shows each submarket's share of closed sales this quarter.
-
Chelsea, Tribeca, Soho, the West Village, Greenwich Village, the East Village, Gramercy, NoMad and more890Closed sales, +9.9%$1,792,500Median sale price, +21.5%$1,871Avg price per sq ft, +4.7%1,512Active listings, −10.4%
Downtown was the standout of the quarter. It had the most closed sales, the highest price per square foot and a 21.5% jump in its median sale price. Condo sales climbed 26.5%, and the median condo price reached $2,700,000. See Downtown homes first on Compass.
-
Carnegie Hill, Lenox Hill, the Upper East Side and Yorkville638Closed sales, −9.6%$1,350,000Median sale price, +4.0%$1,371Avg price per sq ft, +2.9%1,126Active listings, −10.4%
Sales slowed from a year ago, but prices held up. Larger co-ops were in demand: the median 2-bedroom co-op rose 18.3% to $1,550,000, and the median 3-bedroom co-op rose 16.4% to $2,800,000. See Upper East Side homes first on Compass.
-
Lincoln Square, Manhattan Valley and the Upper West Side589Closed sales, −0.5%$1,250,000Median sale price, −4.8%$1,460Avg price per sq ft, −2.7%814Active listings, −24.7%
The Upper West Side had the biggest drop in supply in Manhattan, with active listings down 24.7%. Condo sales still rose 12.9%, and the median contract price climbed 4.6% to $1,355,000, so buyers here face fewer choices. See Upper West Side homes first on Compass.
-
Midtown, Murray Hill, Kips Bay, Sutton Place, Turtle Bay, Tudor City and the Garment District561Closed sales, +11.3%$950,000Median sale price, +2.2%$1,416Avg price per sq ft, +0.7%1,253Active listings, −8.9%
Midtown East posted one of the biggest sales gains, up 11.3%, driven by co-ops, where sales jumped 22.1%. The median contract price rose 6.2% to $1,049,500. See Midtown East homes first on Compass.
-
Harlem, East Harlem, Hamilton Heights, Morningside Heights, Washington Heights, Inwood and more238Closed sales, +15.5%$615,000Median sale price, +1.9%188Contracts signed, +2.2%549Active listings, −11.6%
Upper Manhattan led all submarkets in sales growth, up 15.5%, with condo sales up 38.1%. It was also the only submarket where contracts signed rose from a year ago. See Upper Manhattan homes first on Compass.
-
The Financial District and Battery Park City115Closed sales, −24.8%$1,055,000Median sale price, −19.2%$1,369Avg price per sq ft, −4.5%400Active listings, +8.4%
FiDi/BPC was the only submarket where inventory grew, up 8.4%, while sales and prices softened. For buyers, that means more choice and more room to negotiate than anywhere else in Manhattan. See FiDi / Battery Park City homes first on Compass.
-
Clinton/Hell's Kitchen and Hudson Yards114Closed sales, +0.9%$982,500Median sale price, +4.0%$2,437,325Avg contract price, +32.1%338Active listings, −5.6%
Sales were steady, and the average contract price jumped 32.1%, a sign of more higher-end deals going into contract. The median 3-bedroom condo price rose 81.1% from a year ago to $3,849,500. See Midtown West homes first on Compass.
What the Q3 2026 market means for buyers and sellers
- Demand is firmly in place.Closed sales rose even with the fewest new listings in a decade, and year-to-date contracts are up 3.1%.
- Sellers with the right homes are in a strong position.With supply this tight, well-priced, move-in-ready homes stand out and attract competing buyers.
- Buyers are focused on quality and value.Homes that need work or are priced ambitiously are sitting longer, and 28% took more than six months to go into contract.
- The luxury market has momentum.Sales from $3 million to $5 million jumped 32.2%, and contracts above $20 million rose 75.0%.
Frequently asked questions
How is the Manhattan real estate market doing in Q3 2026?
The Manhattan market held up well in the third quarter of 2026. There were 3,183 closed sales, up 2.7% from Q3 2025, even though new listings fell 28.4% to the lowest third-quarter level in a decade and total inventory was down 10.9%.
What is the median home price in Manhattan in Q3 2026?
The median sale price in Manhattan was $1,250,000 in Q3 2026, up 4.6% from a year earlier. The median condo price was $1,786,519 and the median co-op price was $887,500. The average sale price was $1,989,564.
Is housing inventory low in Manhattan right now?
Yes. There were 6,028 active listings at the end of Q3 2026, down 10.9% from a year ago and 8.9% from Q2. Only 2,251 new listings came to market, down 28.4% and the lowest Q3 total in 10 years. The Upper West Side saw the steepest drop, with inventory down 24.7%.
Which Manhattan neighborhoods performed best in Q3 2026?
Upper Manhattan led in sales growth (up 15.5%), followed by Midtown East (up 11.3%) and Downtown (up 9.9%). Downtown also posted the strongest price gains, with its median sale price up 21.5% to $1,792,500.
How is the Manhattan luxury market performing?
Sales between $3 million and $5 million jumped 32.2%, and condo sales from $5 million to $10 million rose 21.3%. At the very top, 14 contracts were signed above $20 million, a 75.0% increase from a year earlier, even though closed sales above $10 million were lower due to limited inventory.
Are Manhattan homes selling below asking price?
On average, homes sold for about 6% below their initial list price in Q3 2026, down from 7% a year earlier. Condos averaged a 7% discount and co-ops a 5% discount.
How long does it take to sell a home in Manhattan?
Homes that entered contract in Q3 2026 averaged 99 days on market, and 28% took more than 180 days. Well-priced homes in good condition sold faster, while properties that needed work or were priced ambitiously took longer.
Is now a good time to buy or sell in Manhattan?
With supply this constrained, well-priced homes stand out, which favors sellers with desirable properties. Buyers who are prepared to act still have real opportunities, especially in areas with more inventory such as FiDi/Battery Park City. Every situation is different, so reach out for a private consultation about your building or neighborhood.
Thinking about buying or selling in Manhattan? Contact Darrell Williams for a private consultation and custom market data, or view my Compass profile and listings.
Data source: Compass Manhattan Market Report, Q3 2026, based on REBNY RLS and ACRIS data. Current-quarter figures reflect data from July 1 through September 20, 2026, and will be updated in later reports. Discount is the difference between the initial list price and the recorded sale price. Information is deemed reliable but is subject to errors, omissions, and changes without notice.